| |
Institutional
Holders
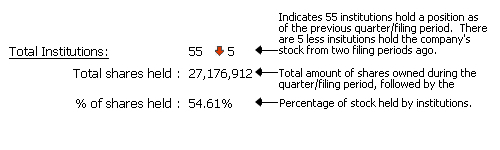
Total
Institutions:
 |
135  7 7 |
|
|
Total
shares held :
|
232,237,101 |
|
|
% of shares
held :
|
49.02% |
|
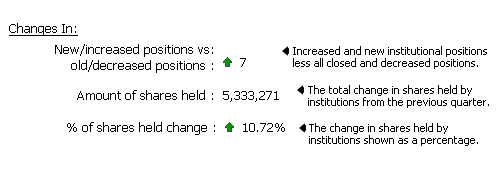
| Changes In:
|
|
|
|
New/increased
positions vs
old/decreased
positions :
|
0 |
|
|
Amount
of shares held :
|
-3,158,325 |
|
|
% of shares
held change :
|
-0.67% |
|
| Quarter
Price vs. Current Price:
|
|
|
Quarter Price vs.
Current Price:
|
|
|
|
|
|
|
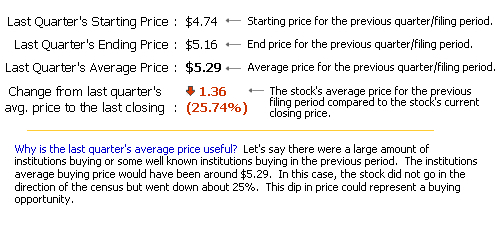
Last
Quarter's Starting
Price :
|
$2.02 |
|
|
Last
Quarter's Ending
Price :
|
$2.53 |
|
|
Last
Quarter's Average
Price :
|
$2.40 |
|
|
Change
from last quarter's
avg. price
to the last closing :
|
|
|
 2.12 (88.33%) 2.12 (88.33%) |
|
|
|

|

|


|
| All
Securities Held : |
Positions
|
Shares
|
%
Of
Total Shares
|
|
|
New
Positions : |
14
|
17,670,573
|
7.61%
|
|
|
|
Increased
Positions : |
49
|
17,143,486
|
7.38%
|
|
|
|
Unchanged
Positions : |
30
|
6,527,990
|
2.81%
|
|
 |
Decreased
Positions : |
42
|
-15,469,022
|
-6.66%
|
|
|
|
Closed
Positions : |
21
|
-22,503,362
|
-9.69%
|
|
|
|
Guru
Positions : |
1
|
19,000
|
0.01%
|
|
|

|
Free Registration Required For Full Results
|
Institution Name |
Portfolio
Position |
New/Closed
Position |
Filing Date |
Total Shares |
Total Value |
Change in Shares |
File |
  RENAISSANCE TECHNOLOGIES LLC RENAISSANCE TECHNOLOGIES LLC |
369 |
- |
2023-12-31 |
15,303,296 |
$38,717,000 |
-507,600 |
|
| FMR LLC |
1662 |
- |
2023-12-31 |
6,288,100 |
$15,850,000 |
-711,900 |
|
| TWO SIGMA ADVISERS, LLC |
452 |
- |
2023-12-31 |
4,901,700 |
$12,401,000 |
-641,900 |
|
| TWO SIGMA INVESTMENTS LLC |
526 |
- |
2023-12-31 |
4,666,810 |
$11,807,000 |
-1,191,996 |
|
| MORGAN STANLEY |
3550 |
- |
2023-12-31 |
2,955,092 |
$7,476,000 |
-200,958 |
|
| D E SHAW & CO INC |
912 |
- |
2023-12-31 |
2,784,348 |
$7,038,000 |
-441,915 |
|
| MILLENNIUM MANAGEMENT LLC |
1700 |
- |
2023-12-31 |
2,422,947 |
$6,127,000 |
-1,283,241 |
|
| BANK OF MONTREAL /CAN/ |
1024 |
- |
2023-12-31 |
2,132,503 |
$5,440,000 |
-92,116 |
|
| MACKENZIE FINANCIAL CORP |
579 |
- |
2024-03-31 |
1,280,140 |
$4,273,000 |
-207,579 |
|
| Connor Clark & Lunn Investment Management Ltd. |
533 |
- |
2024-03-31 |
973,431 |
$3,250,000 |
-271,800 |
|
| BANK OF AMERICA CORP /DE/ |
3210 |
- |
2023-12-31 |
1,207,251 |
$3,054,000 |
-288,851 |
|
| SPROTT INC. |
63 |
- |
2023-12-31 |
1,100,103 |
$2,783,000 |
-179,297 |
|
| CITADEL ADVISORS LLC |
2165 |
- |
2023-12-31 |
954,087 |
$2,414,000 |
-1,355,968 |
|
| LEGAL & GENERAL GROUP PLC |
1887 |
- |
2023-12-31 |
894,401 |
$2,265,000 |
-397,972 |
|
| GOLDMAN SACHS GROUP INC/ |
3111 |
- |
2023-12-31 |
816,733 |
$2,066,000 |
-232,929 |
|
| JANE STREET GROUP LLC |
2810 |
- |
2023-12-31 |
551,683 |
$1,396,000 |
-136,281 |
|
| J P MORGAN CHASE & CO |
3181 |
- |
2024-03-31 |
413,176 |
$1,376,000 |
-584,032 |
|
| Qube Research & Technologies Ltd |
1519 |
- |
2023-12-31 |
502,233 |
$1,271,000 |
-474,465 |
|
| SG AMERICAS SECURITIES LLC |
913 |
- |
2024-03-31 |
366,162 |
$1,219,000 |
-3,492 |
|
| Russell Investments Group Ltd. |
1893 |
- |
2024-03-31 |
333,661 |
$1,111,000 |
-1,652,253 |
|
| U S GLOBAL INVESTORS INC |
65 |
- |
2024-03-31 |
250,000 |
$833,000 |
-50,000 |
|
| Caption Management LLC |
185 |
- |
2023-12-31 |
266,888 |
$675,000 |
-72,712 |
|
| DORCHESTER WEALTH MANAGEMENT Co |
98 |
- |
2024-03-31 |
169,100 |
$564,000 |
-2,700 |
|
| CIBC WORLD MARKETS CORP |
724 |
- |
2023-12-31 |
80,000 |
$202,000 |
-90,000 |
|
| Cubist Systematic Strategies LLC |
1697 |
- |
2023-12-31 |
62,627 |
$158,000 |
-328,878 |
|
| AIGEN INVESTMENT MANAGEMENT LP |
710 |
- |
2023-12-31 |
54,907 |
$138,000 |
-32,207 |
|
| GEORGIA BENNICAS DBA BENNICAS & ASSOCIATES |
95 |
- |
2022-12-31 |
50,433 |
$130,000 |
-11,333 |
|
| Beacon Pointe Advisors LLC |
1241 |
- |
2023-12-31 |
44,833 |
$113,000 |
-600 |
|
| COMMONWEALTH EQUITY SERVICES LLC. |
3736 |
- |
2024-03-31 |
30,806 |
$103,000 |
-2,946 |
|
| LGT Group Foundation |
247 |
- |
2023-12-31 |
36,300 |
$92,000 |
-5,050 |
|
| TD Waterhouse Canada Inc. |
921 |
- |
2024-03-31 |
18,400 |
$90,000 |
-40,000 |
|
| Squarepoint Ops LLC |
2304 |
- |
2023-12-31 |
30,851 |
$78,000 |
-20,665 |
|
| SHELL ASSET MANAGEMENT CO |
1120 |
- |
2023-12-31 |
28,882 |
$73,000 |
-7,200 |
|
| GROUP ONE TRADING, L.P. |
919 |
- |
2024-03-31 |
17,989 |
$60,000 |
-146,069 |
|
| Advisor Group Holdings Inc. |
4608 |
- |
2024-03-31 |
16,781 |
$56,000 |
-14,314 |
|
| FRUTH INVESTMENT MANAGEMENT |
221 |
- |
2024-03-31 |
17,000 |
$56,000 |
-1,000 |
|
| LEUCADIA NATIONAL CORP -- Notable Guru -- |
1047 |
- |
2023-12-31 |
19,000 |
$48,000 |
-21,000 |
|
| OPPENHEIMER & CO INC |
1413 |
- |
2024-03-31 |
12,608 |
$42,000 |
-865 |
|
| ENVESTNET ASSET MANAGEMENT INC |
3966 |
- |
2023-12-31 |
15,396 |
$39,000 |
-10,813 |
|
| GOTHAM ASSET MANAGEMENT, LLC |
1318 |
- |
2023-12-31 |
11,542 |
$29,000 |
-41,117 |
|
| WELLS FARGO & CO/MN |
5234 |
- |
2024-03-31 |
1,826 |
$6,000 |
-4,930 |
|
| TOWER RESEARCH CAPITAL LLC |
5024 |
- |
2023-12-31 |
1,600 |
$4,000 |
-42,193 |
|
|
42 Records found
|
1
|
Page 1 of 1 |
|
Download: (Current
Quarter Only)
|
|
|
Download only Institutional Holders.
(Default)
Download only
Summary Infomation.
Download
both Summary and Institutional Data
|
|
|
|
Free Registration Required For Full Results
|
|
|