| |
| |
|
|
| Last Closing Day Summary - Sells |
 |
Explanation |
|
| |
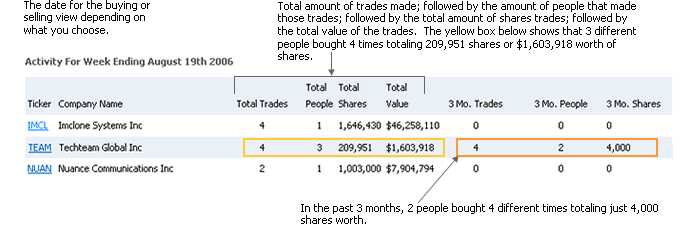
Below are today's Form 4 insider selling
transaction data filed with the SEC (Securities & Exchange
Commission, www.sec.gov). Transactions are grouped
by company showing the amount of insiders and combined transaction
data. Also represented within each group is the company's
transaction summary history for the last 3 month. Data
will show how many insiders, the total amount of transactions
that occurred, the amount of combined shares sold and the combined
shares market value. Insider transaction data is
updated every 0-5 min Monday - Friday. The Form 3 (Initial
Ownership Statement), Form 4 (Change in Ownership) and form
5 (Insider who has at least one transaction which was not reported
during the year) are also sent in our daily summary emails. |
|
|
|
|
 |
Download |
|
Menu
 |
Ticker |
Company Name |
Total Trades |
Total People |
Total Shares |
Total Value |
3 Mo. Trades |
3 Mo. People |
3 Mo. Shares |


|
CIVI |
Civitas Resources Ord Shs |
1 |
1 |
6,956,520 |
$509,356,394 |
0 |
0 |
0 |
|
|
PR |
Permian Resources Corp |
2 |
2 |
10,065,000 |
$165,267,300 |
0 |
0 |
0 |
|
|
XPO |
XPO Logistics Inc |
1 |
1 |
1,250,000 |
$141,222,334 |
0 |
0 |
0 |
|
|
MA |
MasterCard Inc A |
1 |
1 |
129,000 |
$59,556,746 |
0 |
0 |
0 |
|
|
TDW |
Tidewater Inc |
5 |
1 |
508,434 |
$54,419,133 |
0 |
0 |
0 |
|
|
JOE |
St Joe Co |
3 |
1 |
433,700 |
$25,309,566 |
0 |
0 |
0 |
|
|
MTSI |
MA Com Technology Solutions Holdings Inc |
2 |
1 |
232,361 |
$23,904,496 |
0 |
0 |
0 |
|
|
MEDP |
Medpace Holdings, Inc. |
2 |
1 |
39,342 |
$15,924,222 |
0 |
0 |
0 |
|
|
CVLT |
Commvault Systems Inc |
6 |
4 |
63,900 |
$7,073,717 |
0 |
0 |
0 |
|
|
MP |
Mp Materials Ord Shs Class A |
1 |
1 |
317,750 |
$5,741,743 |
0 |
0 |
0 |
|
|
OSIS |
OSI Systems Inc |
1 |
1 |
40,000 |
$5,589,823 |
0 |
0 |
0 |
|
|
ETN |
Eaton Corp |
1 |
1 |
16,180 |
$5,414,545 |
0 |
0 |
0 |
|
|
VRT |
Vertiv Holdings Co |
2 |
1 |
50,000 |
$5,194,802 |
0 |
0 |
0 |
|
|
EQIX |
Equinix Inc |
2 |
1 |
4,870 |
$3,900,688 |
0 |
0 |
0 |
|
|
TINVU |
Tiga Acquisition Corp. |
2 |
1 |
302,490 |
$2,906,694 |
0 |
0 |
0 |
|
|
IRM |
Iron Mountain Inc |
2 |
1 |
31,750 |
$2,599,691 |
0 |
0 |
0 |
|
|
CHE |
Chemed Corp |
1 |
1 |
4,000 |
$2,270,160 |
0 |
0 |
0 |
|
|
RRGB |
Red Robin Gourmet Burgers Inc |
3 |
1 |
319,105 |
$2,258,801 |
0 |
0 |
0 |
|
|
APPF |
Appfolio Inc |
1 |
1 |
8,210 |
$2,050,495 |
0 |
0 |
0 |
|
|
Z |
Zillow Group Inc |
9 |
6 |
46,229 |
$2,045,240 |
0 |
0 |
0 |
|
|
MODN |
Model N, Inc. |
7 |
7 |
67,363 |
$2,006,743 |
0 |
0 |
0 |
|
|
ACEL |
Accel Entertainment Inc |
2 |
1 |
200,000 |
$1,959,578 |
0 |
0 |
0 |
|
|
SLGN |
Silgan Holdings Inc |
1 |
1 |
36,177 |
$1,709,964 |
0 |
0 |
0 |
|
|
PG |
Procter & Gamble Co |
1 |
1 |
9,149 |
$1,534,449 |
0 |
0 |
0 |
|
|
TREX |
Trex Co Inc |
1 |
1 |
16,440 |
$1,494,472 |
1 |
1 |
35 |
|
| |
Transaction
Code Key: |
Ownership
Code Key |
| |
B |
- Buy |
AB |
- Automatic
Buy |
D |
- Direct Ownership |
| |
S |
- Sell |
AS |
- Automatic
Sell |
I |
- Indirect
Ownership |
| |
OE |
- Options
Exercised |
A |
- Acquired |
| |
IO |
- Initital
Ownership |
D |
- Disposed |
| |
|
|
|
|
|
|
|