| |
| Weekly Summary - Buys |
 |
Explanation |
| |
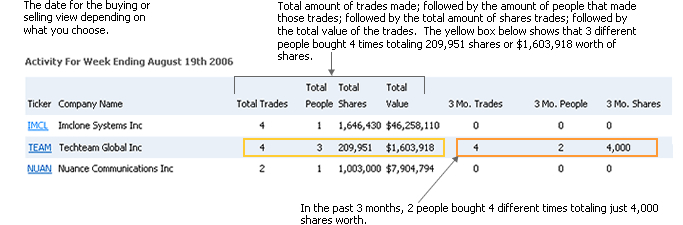
Below are today's Form 4 insider buying
transaction data filed with the SEC (Securities & Exchange
Commission, www.sec.gov). Transactions are grouped
by company showing the amount of insiders and combined transaction
data. Also represented within each group is the company's
transaction summary history for the last 3 month. Data
will show how many insiders, the total amount of transactions
that occurred, the amount of combined shares purchased and the
combined shares market value. Insider transaction
data is updated every 0-5 min Monday - Friday. The Form
3 (Initial Ownership Statement), Form 4 (Change in Ownership)
and form 5 (Insider who has at least one transaction which was
not reported during the year) are also sent in our daily summary
emails. |
|
|
| |
|
Activity For April 28th 2024
|
|
 |
Download |
|
Menu
 |
Ticker |
Company Name |
Total Trades |
| Avg. Rank |
 |
|
Total People |
Total Shares |
Total Value |
3 Mo. Trades |
3 Mo. People |
3 Mo. Shares |


|
RXO |
Rxo, Inc. |
7 |
0.01 |
1 |
1,545,690 |
$30,210,276 |
10 |
1 |
3,967,144 |
|
|
LSXMA |
Liberty Media Corporation |
6 |
0.01 |
1 |
1,147,016 |
$28,188,533 |
42 |
1 |
33,314,641 |
|
|
BHVN |
Biohaven Ltd. |
4 |
0.01 |
3 |
391,355 |
$15,999,101 |
4 |
3 |
391,355 |
|
|
EYPT |
EyePoint Pharmaceuticals Inc |
1 |
0.01 |
1 |
581,765 |
$10,489,446 |
1 |
1 |
581,765 |
|
|
STCN |
Steel Connect Inc |
4 |
2.25 |
1 |
966,572 |
$10,076,492 |
4 |
1 |
743,555 |
|
|
KRRO |
Korro Bio |
10 |
0.25 |
10 |
178,570 |
$9,999,920 |
10 |
10 |
178,570 |
|
|
MSCI |
Msci Inc |
2 |
2.74 |
2 |
20,500 |
$9,502,530 |
0 |
0 |
0 |
|
|
ZURA |
Zura Bio Ltd |
4 |
0.01 |
4 |
1,357,827 |
$4,249,998 |
4 |
4 |
1,357,827 |
|
|
HQL |
Tekla Life Sciences Investors |
6 |
1.5 |
1 |
292,525 |
$3,788,158 |
5 |
2 |
174,822 |
|
|
CTRN |
Citi Trends Inc |
6 |
1.5 |
1 |
90,595 |
$1,998,389 |
25 |
2 |
535,025 |
|
|
INTZ |
Intrusion Inc |
2 |
2.74 |
2 |
595,748 |
$1,012,772 |
2 |
2 |
595,748 |
|
|
RF |
Regions Financial Corp |
1 |
2.1 |
1 |
50,000 |
$968,500 |
1 |
1 |
50,000 |
|
|
BRT |
BRT Realty Trust |
6 |
0.01 |
3 |
55,050 |
$923,760 |
50 |
3 |
440,826 |
|
|
TTS |
Tile Shop Holdings, Inc. |
3 |
0.01 |
1 |
127,138 |
$804,379 |
41 |
2 |
1,853,082 |
|
|
HROW |
Harrow Health Inc |
4 |
1.5 |
1 |
69,400 |
$714,431 |
7 |
2 |
179,000 |
|
|
INMB |
Inmune Bio, Inc. |
4 |
3.41 |
4 |
80,082 |
$666,282 |
4 |
4 |
80,082 |
|
|
GL |
Globe Life Inc |
4 |
2.32 |
4 |
6,819 |
$530,865 |
0 |
0 |
0 |
|
|
VIVK |
Vivakor, Inc. |
4 |
3.23 |
1 |
270,000 |
$376,665 |
4 |
1 |
270,000 |
|
|
NQP |
Nuveen Pennsylvania Investment Quality Municipal Fund Inc |
1 |
1.5 |
1 |
31,908 |
$365,666 |
14 |
1 |
366,373 |
|
|
MAV |
Pioneer Municipal High Income Advantage Trust |
2 |
1.5 |
1 |
46,486 |
$363,131 |
5 |
1 |
97,802 |
|
|
IZEA |
Izea Worldwide Inc |
3 |
1.5 |
1 |
101,337 |
$271,058 |
2 |
1 |
7,136 |
|
|
BRN |
Barnwell Industries Inc |
5 |
1.5 |
1 |
90,474 |
$252,036 |
9 |
2 |
152,224 |
|
|
LIND |
Lindblad Expeditions Holdings Inc |
1 |
0.01 |
1 |
33,016 |
$246,663 |
1 |
1 |
33,016 |
|
|
GCTK |
Integrity Applications, Inc. |
1 |
3.92 |
1 |
182,540 |
$230,000 |
1 |
1 |
182,540 |
|
|
EXFY |
Expensify, Inc. |
2 |
0.01 |
2 |
143,639 |
$216,222 |
6 |
1 |
692,827 |
|
| |
Transaction
Code Key: |
Ownership
Code Key |
| |
B |
- Buy |
AB |
- Automatic
Buy |
D |
- Direct Ownership |
| |
S |
- Sell |
AS |
- Automatic
Sell |
I |
- Indirect
Ownership |
| |
OE |
- Options
Exercised |
A |
- Acquired |
| |
IO |
- Initital
Ownership |
D |
- Disposed |
| |
|
|
|
|
|
|
|