| |
| Weekly Summary - Sells |
 |
Explanation |
| |
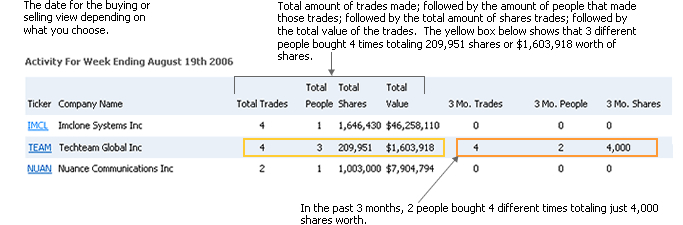
Below are today's Form 4 insider selling
transaction data filed with the SEC (Securities & Exchange
Commission, www.sec.gov). Transactions are grouped
by company showing the amount of insiders and combined transaction
data. Also represented within each group is the company's
transaction summary history for the last 3 month. Data
will show how many insiders, the total amount of transactions
that occurred, the amount of combined shares sold and the combined
shares market value. Insider transaction data is
updated every 0-5 min Monday - Friday. The Form 3 (Initial
Ownership Statement), Form 4 (Change in Ownership) and form
5 (Insider who has at least one transaction which was not reported
during the year) are also sent in our daily summary emails. |
|
|
| |
|
Activity For May 14th 2024
|
|
 |
Download |
|
Menu
 |
Ticker |
Company Name |
Total Trades |
Total People |
Total Shares |
Total Value |
3 Mo. Trades |
3 Mo. People |
3 Mo. Shares |


|
MA |
MasterCard Inc A |
5 |
1 |
731,000 |
$328,740,622 |
25 |
5 |
1,844,905 |
|
|
WCC |
WESCO International |
1 |
1 |
1,750,000 |
$302,785,000 |
3 |
3 |
1,757,219 |
|
|
TRTX |
TPG RE Finance Trust Inc |
2 |
2 |
18,705,882 |
$165,359,996 |
2 |
2 |
18,705,882 |
|
|
CELH |
Celsius Holdings Inc |
5 |
2 |
1,716,129 |
$102,424,647 |
23 |
12 |
15,560,373 |
|
|
MAX |
Mediaalpha, Inc. |
1 |
1 |
5,000,200 |
$95,003,800 |
2 |
2 |
7,950,200 |
|
|
ALKT |
Alkami Technology, Inc. |
4 |
3 |
3,161,510 |
$83,899,120 |
12 |
5 |
3,383,540 |
|
|
WHD |
Cactus Inc |
7 |
3 |
1,202,059 |
$61,791,395 |
9 |
3 |
1,281,759 |
|
|
TDW |
Tidewater Inc |
6 |
5 |
376,017 |
$40,667,928 |
9 |
5 |
421,479 |
|
|
DFIN |
Donnelley Financial Solutions, Inc. |
4 |
2 |
584,096 |
$36,913,025 |
10 |
5 |
886,617 |
|
|
AR |
Antero Resources Corp |
4 |
1 |
1,000,000 |
$34,160,857 |
9 |
3 |
2,038,009 |
|
|
LAUR |
Laureate Education Inc |
1 |
1 |
2,114,928 |
$30,962,546 |
3 |
2 |
2,140,357 |
|
|
AXP |
American Express Co |
3 |
3 |
124,042 |
$28,826,101 |
9 |
7 |
369,495 |
|
|
RH |
Restoration Hardware Holdings Inc |
1 |
1 |
100,000 |
$27,991,922 |
3 |
2 |
103,000 |
|
|
JOE |
St Joe Co |
3 |
1 |
436,500 |
$25,466,397 |
12 |
1 |
606,600 |
|
|
MEDP |
Medpace Holdings, Inc. |
4 |
1 |
60,672 |
$24,439,914 |
47 |
6 |
1,836,004 |
|
|
DAVE |
Dave Ord Shs Class A |
1 |
1 |
450,000 |
$22,005,000 |
4 |
4 |
468,588 |
|
|
CRWD |
Crowdstrike Holdings, Inc. |
2 |
2 |
72,032 |
$21,939,157 |
12 |
6 |
318,465 |
|
|
QSR |
Restaurant Brands International Inc. |
2 |
2 |
254,733 |
$19,145,899 |
21 |
10 |
880,505 |
|
|
TXN |
Texas Instruments Inc |
1 |
1 |
100,440 |
$17,925,682 |
7 |
3 |
536,969 |
|
|
VRNS |
Varonis Systems Inc |
2 |
1 |
331,668 |
$14,968,920 |
3 |
2 |
351,168 |
|
|
MTB |
M&T Bank Corp |
4 |
3 |
85,088 |
$12,601,449 |
11 |
4 |
141,910 |
|
|
NSSC |
Napco Security Systems Inc |
1 |
1 |
250,000 |
$11,050,450 |
6 |
2 |
2,388,000 |
|
|
SCHW |
Charles Schwab Corp |
3 |
2 |
145,128 |
$11,028,534 |
30 |
11 |
839,949 |
|
|
KO |
Coca-Cola Co |
4 |
4 |
172,591 |
$10,768,771 |
7 |
6 |
495,698 |
|
|
JPM |
JP Morgan Chase & Co |
5 |
5 |
54,641 |
$10,537,220 |
17 |
12 |
1,162,876 |
|
| |
Transaction
Code Key: |
Ownership
Code Key |
| |
B |
- Buy |
AB |
- Automatic
Buy |
D |
- Direct Ownership |
| |
S |
- Sell |
AS |
- Automatic
Sell |
I |
- Indirect
Ownership |
| |
OE |
- Options
Exercised |
A |
- Acquired |
| |
IO |
- Initital
Ownership |
D |
- Disposed |
| |
|
|
|
|
|
|
|