| |
| |
|
|
| Last Closing Day Summary - Sells |
 |
Explanation |
|
| |
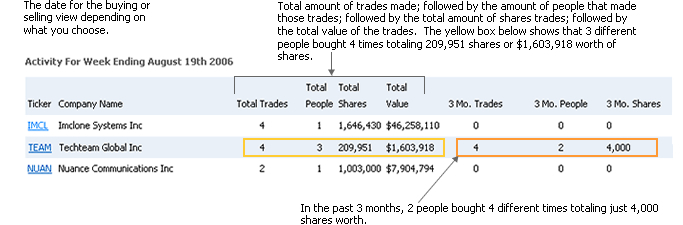
Below are today's Form 4 insider selling
transaction data filed with the SEC (Securities & Exchange
Commission, www.sec.gov). Transactions are grouped
by company showing the amount of insiders and combined transaction
data. Also represented within each group is the company's
transaction summary history for the last 3 month. Data
will show how many insiders, the total amount of transactions
that occurred, the amount of combined shares sold and the combined
shares market value. Insider transaction data is
updated every 0-5 min Monday - Friday. The Form 3 (Initial
Ownership Statement), Form 4 (Change in Ownership) and form
5 (Insider who has at least one transaction which was not reported
during the year) are also sent in our daily summary emails. |
|
|
|
|
 |
Download |
|
Menu
 |
Ticker |
Company Name |
Total Trades |
Total People |
Total Shares |
Total Value |
3 Mo. Trades |
3 Mo. People |
3 Mo. Shares |


|
SYK |
Stryker Corp |
2 |
1 |
500,000 |
$181,719,269 |
0 |
0 |
0 |
|
|
HTFL |
Heartflow, Inc. |
1 |
1 |
2,000,000 |
$56,100,000 |
1 |
1 |
40,000 |
|
|
ITW |
Illinois Tool Works Inc |
1 |
1 |
167,345 |
$48,686,119 |
1 |
1 |
6,709 |
|
|
CLS |
Celestica Inc (USA) |
5 |
4 |
123,158 |
$37,789,295 |
0 |
0 |
0 |
|
|
AMP |
Ameriprise Financial Inc |
1 |
1 |
48,813 |
$26,601,190 |
0 |
0 |
0 |
|
|
PHM |
PulteGroup Inc |
5 |
5 |
181,779 |
$24,392,122 |
0 |
0 |
0 |
|
|
MRK |
Merck & Co Inc |
8 |
8 |
188,603 |
$22,612,601 |
0 |
0 |
0 |
|
|
AXP |
American Express Co |
2 |
2 |
50,810 |
$17,945,364 |
0 |
0 |
0 |
|
|
CL |
Colgate Palmolive Co |
3 |
3 |
165,411 |
$15,578,183 |
0 |
0 |
0 |
|
|
TINVU |
Tiga Acquisition Corp. |
3 |
1 |
1,450,000 |
$14,595,500 |
5 |
1 |
550,000 |
|
|
GOOG |
Alphabet Inc |
1 |
1 |
32,500 |
$10,893,259 |
0 |
0 |
0 |
|
|
AIT |
Applied Industrial Technologies Inc |
3 |
3 |
28,654 |
$8,212,782 |
0 |
0 |
0 |
|
|
NSSC |
Napco Security Systems Inc |
1 |
1 |
150,000 |
$6,411,000 |
0 |
0 |
0 |
|
|
AX |
Axos Financial Inc |
3 |
3 |
59,303 |
$5,908,431 |
0 |
0 |
0 |
|
|
DAL |
Delta Air Lines Inc |
2 |
2 |
76,104 |
$5,352,299 |
0 |
0 |
0 |
|
|
THG |
The Hanover Insurance Group |
1 |
1 |
24,420 |
$4,369,156 |
0 |
0 |
0 |
|
|
URBN |
Urban Outfitters Inc |
6 |
2 |
58,666 |
$4,255,942 |
0 |
0 |
0 |
|
|
BC |
Brunswick Corp |
1 |
1 |
38,266 |
$3,312,305 |
0 |
0 |
0 |
|
|
ARLO |
Arlo Technologies, Inc. |
5 |
2 |
219,344 |
$2,724,409 |
0 |
0 |
0 |
|
|
EVR |
Evercore Partners Inc. |
2 |
2 |
6,450 |
$2,307,950 |
0 |
0 |
0 |
|
|
LFUS |
LittelFuse Inc |
2 |
1 |
6,000 |
$2,023,362 |
0 |
0 |
0 |
|
|
YUM |
YUM! Brands Inc |
1 |
1 |
12,000 |
$1,937,280 |
0 |
0 |
0 |
|
|
SANM |
Sanmina-SCI Corp |
1 |
1 |
13,150 |
$1,935,812 |
0 |
0 |
0 |
|
|
VIAV |
VIAVI Solutions Inc |
1 |
1 |
70,566 |
$1,853,852 |
0 |
0 |
0 |
|
|
WDC |
Western Digital Corp |
1 |
1 |
6,780 |
$1,833,922 |
0 |
0 |
0 |
|
| |
Transaction
Code Key: |
Ownership
Code Key |
| |
B |
- Buy |
AB |
- Automatic
Buy |
D |
- Direct Ownership |
| |
S |
- Sell |
AS |
- Automatic
Sell |
I |
- Indirect
Ownership |
| |
OE |
- Options
Exercised |
A |
- Acquired |
| |
IO |
- Initital
Ownership |
D |
- Disposed |
| |
|
|
|
|
|
|
|