| |
| Today's Summary Breakdown
- Buys |
 |
Explanation |
|
|
| |
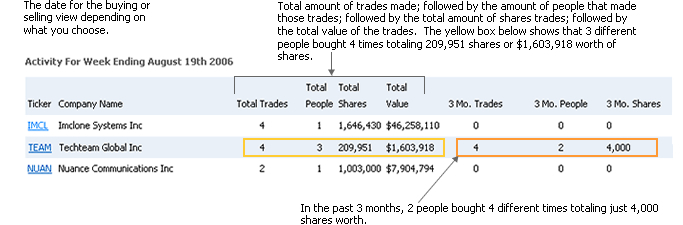
Below are today's Form 4 insider buying
transaction data filed with the SEC (Securities & Exchange
Commission, www.sec.gov). Transactions are grouped
by company showing the amount of insiders and combined transaction
data. Also represented within each group is the company's
transaction summary history for the last 3 month. Data
will show how many insiders, the total amount of transactions
that occurred, the amount of combined shares purchased and the
combined shares market value. Insider transaction
data is updated every 0-5 min Monday - Friday. The Form
3 (Initial Ownership Statement), Form 4 (Change in Ownership)
and form 5 (Insider who has at least one transaction which was
not reported during the year) are also sent in our daily summary
emails. |
|
|
Activity For January 27th 2026
|
|
 |
Download |
|
Menu
 |
Ticker |
Company Name |
Total Trades |
| Avg. Rank |
 |
|
Total People |
Total Shares |
Total Value |
3 Mo. Trades |
3 Mo. People |
3 Mo. Shares |


|
THM |
International Tower Hill Mines Ltd |
1 |
0.01 |
1 |
18,018,018 |
$40,000,000 |
0 |
0 |
0 |
|
|
MIRM |
Mirum Pharmaceuticals, Inc. |
1 |
0.01 |
1 |
131,425 |
$8,999,984 |
0 |
0 |
0 |
|
|
HYMC |
Hycroft Mining Holding Inc Class A |
1 |
1.5 |
1 |
100,000 |
$4,996,000 |
18 |
1 |
4,215,000 |
|
|
BSGM |
Biosig Technologies, Inc. |
3 |
1.97 |
2 |
1,028,500 |
$3,093,060 |
3 |
2 |
99,511 |
|
|
BDSX |
Biodesix Inc |
2 |
0.01 |
1 |
100,000 |
$1,180,736 |
1 |
1 |
82,465 |
|
|
BST |
Blackrock Science & Technology Trust |
1 |
0.01 |
1 |
16,000 |
$651,200 |
0 |
0 |
0 |
|
|
INTC |
Intel Corp |
1 |
2.74 |
1 |
5,882 |
$249,985 |
0 |
0 |
0 |
|
|
TCGSX |
Tcg Strategic Income Fund |
1 |
2.25 |
1 |
19,841 |
$200,000 |
5 |
2 |
296,450 |
|
|
JYNT |
Joint Corp |
2 |
0.01 |
1 |
17,478 |
$174,780 |
5 |
1 |
29,644 |
|
|
TCBI |
Texas Capital Bancshares Inc |
3 |
2.29 |
2 |
3,000 |
$139,355 |
0 |
0 |
0 |
|
|
EQPT |
Equipmentshare.com Inc |
1 |
2.74 |
1 |
4,285 |
$104,983 |
0 |
0 |
0 |
|
|
ASA |
ASA Gold & Precious Metals Ltd |
1 |
1.5 |
1 |
1,400 |
$102,060 |
45 |
1 |
375,306 |
|
|
BFST |
Business First Bancshares Inc |
1 |
2.39 |
1 |
1,500 |
$41,325 |
0 |
0 |
0 |
|
|
MXF |
Mexico Fund Inc |
1 |
1.5 |
1 |
1,000 |
$21,500 |
18 |
1 |
157,406 |
|
|
JHS |
Hancock John Income Securities Trust |
2 |
2.35 |
2 |
855 |
$10,069 |
0 |
0 |
0 |
|
|
HEQ |
John Hancock Hedged Equity & Income Fund |
1 |
2.39 |
1 |
905 |
$10,046 |
0 |
0 |
0 |
|
|
JHI |
Hancock John Investors Trust |
1 |
2.39 |
1 |
730 |
$10,037 |
0 |
0 |
0 |
|
|
BTO |
Hancock John Bank & Thrift Opportunity Fund |
1 |
2.39 |
1 |
270 |
$10,001 |
0 |
0 |
0 |
|
|
HPS |
John Hancock Preferred Income Fund III |
1 |
2.39 |
1 |
683 |
$10,001 |
0 |
0 |
0 |
|
|
HPI |
John Hancock Preferred Income Fund |
1 |
2.39 |
1 |
614 |
$10,001 |
0 |
0 |
0 |
|
|
HPF |
John Hancock Preferred Income Fund II |
1 |
2.39 |
1 |
618 |
$10,001 |
0 |
0 |
0 |
|
|
PDT |
Hancock John Patriot Premium Dividend Fund II |
1 |
2.39 |
1 |
774 |
$10,001 |
0 |
0 |
0 |
|
|
HTD |
John Hancock Tax-Advantaged Dividend Income Fund |
1 |
2.39 |
1 |
415 |
$10,001 |
0 |
0 |
0 |
|
|
IRIX |
Iridex Corp |
1 |
0.01 |
1 |
3,385 |
$5,009 |
18 |
2 |
146,954 |
|
|
DLPN |
Dolphin Entertainment Inc |
1 |
2.73 |
1 |
2,700 |
$4,874 |
11 |
1 |
35,302 |
|
|
TOF |
Tofutti Brands Inc |
1 |
1.42 |
1 |
4,525 |
$3,439 |
8 |
1 |
70,075 |
|
|
RCG |
RENN Global Entrepreneurs Fund, Inc |
2 |
3.61 |
1 |
1,134 |
$3,062 |
114 |
5 |
62,414 |
|
| |
Transaction
Code Key: |
Ownership
Code Key |
| |
B |
- Buy |
AB |
- Automatic
Buy |
D |
- Direct Ownership |
| |
S |
- Sell |
AS |
- Automatic
Sell |
I |
- Indirect
Ownership |
| |
OE |
- Options
Exercised |
A |
- Acquired |
| |
IO |
- Initital
Ownership |
D |
- Disposed |
| |
|
|
|
|
|
|
|