| |
| Today's Summary Breakdown - Sells
|
 |
Explanation |
|
|
|
| |
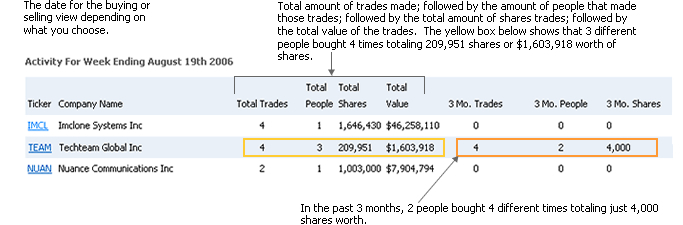
Below are today's Form 4 insiderselling transaction data filed
with the SEC (Securities & Exchange Commission, www.sec.gov). Transactions
are grouped by company showing the amount of insiders and combined
transaction data. Also represented within each group is
the company's transaction summary history for the last 3 month.
Data will show how many insiders, the total amount of
transactions that occurred, the amount of combined shares sold
and the combined shares market value. Insider transaction
data is updated every 0-5 min Monday - Friday. The Form
3 (Initial Ownership Statement), Form 4 (Change in Ownership)
and form 5 (Insider who has at least one transaction which was
not reported during the year) are also sent in our daily summary
emails. |
|
|
Activity For January 27th 2026
|
|
 |
Download |
|
Menu
 |
Ticker |
Company Name |
Total Trades |
Total People |
Total Shares |
Total Value |
3 Mo. Trades |
3 Mo. People |
3 Mo. Shares |


|
GS |
Goldman Sachs Group Inc |
3 |
3 |
16,209 |
$15,003,650 |
0 |
0 |
0 |
|
|
PTGX |
Protagonist Therapeutics, Inc |
7 |
3 |
117,627 |
$9,810,085 |
0 |
0 |
0 |
|
|
SLB |
Schlumberger Ltd |
5 |
5 |
156,902 |
$7,796,667 |
0 |
0 |
0 |
|
|
TINVU |
Tiga Acquisition Corp. |
3 |
1 |
639,000 |
$7,588,830 |
5 |
1 |
550,000 |
|
|
BTGO |
Bitgo Holdings, Inc. |
4 |
4 |
436,007 |
$7,298,757 |
0 |
0 |
0 |
|
|
SYM |
Symbotic Inc |
2 |
2 |
83,988 |
$5,020,996 |
0 |
0 |
0 |
|
|
NTRS |
Northern Trust Corp |
1 |
1 |
25,000 |
$3,740,500 |
1 |
1 |
3,891 |
|
|
REPX |
Riley Exploration Permian Ord Shs |
3 |
1 |
89,943 |
$2,482,645 |
0 |
0 |
0 |
|
|
NAMS |
Newamsterdam Pharma Ord Shs |
2 |
1 |
72,572 |
$2,415,843 |
0 |
0 |
0 |
|
|
TSHA |
Taysha Gene Therapies, Inc. |
6 |
3 |
396,968 |
$1,872,707 |
0 |
0 |
0 |
|
|
MIRM |
Mirum Pharmaceuticals, Inc. |
4 |
4 |
11,869 |
$1,141,703 |
0 |
0 |
0 |
|
|
FAST |
Fastenal Co |
1 |
1 |
15,964 |
$705,454 |
5 |
4 |
5,000 |
|
|
ECAT |
Blackrock Esg Capital Allocation Trust |
1 |
1 |
44,054 |
$684,599 |
0 |
0 |
0 |
|
|
DRI |
Darden Restaurants Inc |
1 |
1 |
3,123 |
$641,210 |
0 |
0 |
0 |
|
|
ADBE |
Adobe Systems Inc |
1 |
1 |
1,646 |
$485,323 |
0 |
0 |
0 |
|
|
GSBC |
Great Southern Bancorp Inc |
1 |
1 |
6,000 |
$364,427 |
0 |
0 |
0 |
|
|
KURA |
Kura Oncology Inc |
6 |
6 |
36,068 |
$305,160 |
0 |
0 |
0 |
|
|
PSMT |
Pricesmart Inc |
1 |
1 |
2,000 |
$282,541 |
0 |
0 |
0 |
|
|
IAE |
Voya Asia Pacific High Dividend Equity Income Fund |
1 |
1 |
31,461 |
$256,093 |
0 |
0 |
0 |
|
|
SRG |
Seritage Growth Properties |
1 |
1 |
5,072 |
$122,396 |
0 |
0 |
0 |
|
|
TWST |
Twist Bioscience Corp |
1 |
1 |
2,390 |
$107,330 |
0 |
0 |
0 |
|
|
HAL |
Halliburton Co |
1 |
1 |
2,600 |
$88,855 |
0 |
0 |
0 |
|
|
ACNB |
ACNB Corp |
1 |
1 |
1,486 |
$72,104 |
2 |
2 |
401 |
|
|
SPMC |
Sound Point Meridian Capital, Inc. |
2 |
1 |
4,867 |
$69,623 |
6 |
2 |
9,480 |
|
|
MDBH |
Mdb Capital Holdings, Llc |
1 |
1 |
60 |
$200 |
10 |
2 |
25,248 |
|
| |
Transaction
Code Key: |
Ownership
Code Key |
| |
B |
- Buy |
AB |
- Automatic
Buy |
D |
- Direct Ownership |
| |
S |
- Sell |
AS |
- Automatic
Sell |
I |
- Indirect
Ownership |
| |
OE |
- Options
Exercised |
A |
- Acquired |
| |
IO |
- Initital
Ownership |
D |
- Disposed |
| |
|
|
|
|
|
|
|